
With trillions of dollars in cash sitting on their balance sheets, corporations have never had so much money. How executives choose to invest that massive amount of capital will drive corporate strategies and determine their companies’ competitiveness for the next decade and beyond. And in the short term, today’s capital budgeting decisions will influence the developed world’s chronic unemployment situation and tepid economic recovery.
Although investment opportunities vary dramatically across companies and industries, one would expect the process of evaluating financial returns on investments to be fairly uniform. After all, business schools teach more or less the same evaluation techniques. It’s no surprise, then, that in a survey conducted by the Association for Financial Professionals (AFP), 80% of more than 300 respondents—and 90% of those with over $1 billion in revenues—use discounted cash-flow analyses. Such analyses rely on free-cash-flow projections to estimate the value of an investment to a firm, discounted by the cost of capital (defined as the weighted average of the costs of debt and equity). To estimate their cost of equity, about 90% of the respondents use the capital asset pricing model (CAPM), which quantifies the return required by an investment on the basis of the associated risk.
But that is where the consensus ends. The AFP asked its global membership, comprising about 15,000 top financial officers, what assumptions they use in their financial models to quantify investment opportunities. Remarkably, no question received the same answer from a majority of the more than 300 respondents, 79% of whom are in the U.S. or Canada. (See the exhibit “Dangerous Assumptions.”)
That’s a big problem, because assumptions about the costs of equity and debt, overall and for individual projects, profoundly affect both the type and the value of the investments a company makes. Expectations about returns determine not only what projects managers will and will not invest in, but also whether the company succeeds financially.
Say, for instance, an investment of $20 million in a new project promises to produce positive annual cash flows of $3.25 million for 10 years. If the cost of capital is 10%, the net present value of the project (the value of the future cash flows discounted at that 10%, minus the $20 million investment) is essentially break-even—in effect, a coin-toss decision. If the company has underestimated its capital cost by 100 basis points (1%) and assumes a capital cost of 9%, the project shows a net present value of nearly $1 million—a flashing green light. But if the company assumes that its capital cost is 1% higher than it actually is, the same project shows a loss of nearly $1 million and is likely to be cast aside.
Nearly half the respondents to the AFP survey admitted that the discount rate they use is likely to be at least 1% above or below the company’s true rate, suggesting that a lot of desirable investments are being passed up and that economically questionable projects are being funded. It’s impossible to determine the precise effect of these miscalculations, but the magnitude starts to become clear if you look at how companies typically respond when their cost of capital drops by 1%. Using certain inputs from the Federal Reserve Board and our own calculations, we estimate that a 1% drop in the cost of capital leads U.S. companies to increase their investments by about $150 billion over three years. That’s obviously consequential, particularly in the current economic environment.
Let’s look at more of the AFP survey’s findings, which reveal that most companies’ assumed capital costs are off by a lot more than 1%.
See how terminal value growth assumptions affect a project’s overall value with the interactive tool: What is Your Cost of Capital?
The Investment Time Horizon
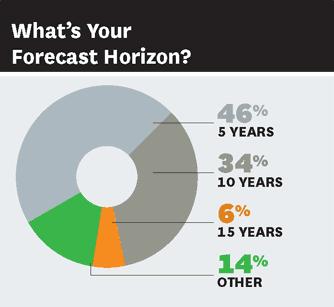
The miscalculations begin with the forecast periods. Of the AFP survey respondents, 46% estimate an investment’s cash flows over five years, 40% use either a 10- or a 15-year horizon, and the rest select a different trajectory.
Some differences are to be expected, of course. A pharmaceutical company evaluates an investment in a drug over the expected life of the patent, whereas a software producer uses a much shorter time horizon for its products. In fact, the horizon used within a given company should vary according to the type of project, but we have found that companies tend to use a standard, not a project-specific, time period. In theory, the problem can be mitigated by using the appropriate terminal value: the number ascribed to cash flows beyond the forecast horizon. In practice, the inconsistencies with terminal values are much more egregious than the inconsistencies in investment time horizons, as we will discuss. (See the sidebar “How to Calculate Terminal Value.”)
The Cost of Debt
Having projected an investment’s expected cash flows, a company’s managers must next estimate a rate at which to discount them. This rate is based on the company’s cost of capital, which is the weighted average of the company’s cost of debt and its cost of equity.
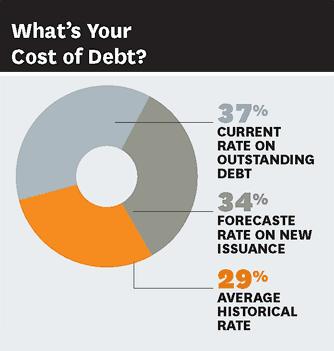
Estimating the cost of debt should be a no-brainer. But when survey participants were asked what benchmark they used to determine the company’s cost of debt, only 34% chose the forecasted rate on new debt issuance, regarded by most experts as the appropriate number. More respondents, 37%, said they apply the current average rate on outstanding debt, and 29% look at the average historical rate of the company’s borrowings. When the financial officers adjusted borrowing costs for taxes, the errors were compounded. Nearly two-thirds of all respondents (64%) use the company’s effective tax rate, whereas fewer than one-third (29%) use the marginal tax rate (considered the best approach by most experts), and 7% use a targeted tax rate.
This seemingly innocuous decision about what tax rate to use can have major implications for the calculated cost of capital. The median effective tax rate for companies on the S&P 500 is 22%, a full 13 percentage points below most companies’ marginal tax rate, typically near 35%. At some companies this gap is more dramatic. GE, for example, had an effective tax rate of only 7.4% in 2010. Hence, whether a company uses its marginal or effective tax rates in computing its cost of debt will greatly affect the outcome of its investment decisions. The vast majority of companies, therefore, are using the wrong cost of debt, tax rate, or both—and, thereby, the wrong debt rates for their cost-of-capital calculations. (See the exhibit “The Consequences of Misidentifying the Cost of Capital.”)
The Risk-Free Rate
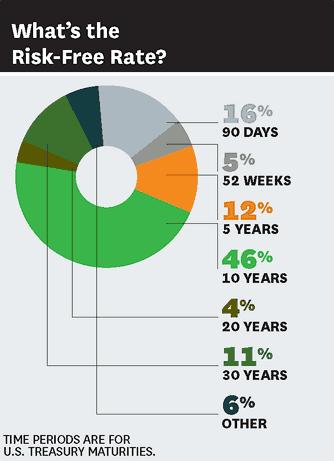
Errors really begin to multiply as you calculate the cost of equity. Most managers start with the return that an equity investor would demand on a risk-free investment. What is the best proxy for such an investment? Most investors, managers, and analysts use U.S. Treasury rates as the benchmark. But that’s apparently all they agree on. Some 46% of our survey participants use the 10-year rate, 12% go for the five-year rate, 11% prefer the 30-year bond, and 16% use the three-month rate. Clearly, the variation is dramatic. When this article was drafted, the 90-day Treasury note yielded 0.05%, the 10-year note yielded 2.25%, and the 30-year yield was more than 100 basis points higher than the 10-year rate.
In other words, two companies in similar businesses might well estimate very different costs of equity purely because they don’t choose the same U.S. Treasury rates, not because of any essential difference in their businesses. And even those that use the same benchmark may not necessarily use the same number. Slightly fewer than half of our respondents rely on the current value as their benchmark, whereas 35% use the average rate over a specified time period, and 14% use a forecasted rate.
The Equity Market Premium
The next component in a company’s weighted-average cost of capital is the risk premium for equity market exposure, over and above the risk-free return. In theory, the market-risk premium should be the same at any given moment for all investors. That’s because it’s an estimate of how much extra return, over the risk-free rate, investors expect will justify putting money in the stock market as a whole.
The estimates, however, are shockingly varied. About half the companies in the AFP survey use a risk premium between 5% and 6%, some use one lower than 3%, and others go with a premium greater than 7%—a huge range of more than 4 percentage points. We were also surprised to find that despite the turmoil in financial markets during the recent economic crisis, which would in theory prompt investors to increase the market-risk premium, almost a quarter of companies admitted to updating it seldom or never.
The Risk of the Company Stock
The final step in calculating a company’s cost of equity is to quantify the beta, a number that reflects the volatility of the firm’s stock relative to the market. A beta greater than 1.0 reflects a company with greater-than-average volatility; a beta less than 1.0 corresponds to below-average volatility. Most financial executives understand the concept of beta, but they can’t agree on the time period over which it should be measured: 41% look at it over a five-year period, 29% at one year, 15% go for three years, and 13% for two.
Reflecting on the impact of the market meltdown in late 2008 and the corresponding spike in volatility, you see that the measurement period significantly influences the beta calculation and, thereby, the final estimate of the cost of equity. For the typical S&P 500 company, these approaches to calculating beta show a variance of 0.25, implying that the cost of capital could be misestimated by about 1.5%, on average, owing to beta alone. For sectors, such as financials, that were most affected by the 2008 meltdown, the discrepancies in beta are much larger and often approach 1.0, implying beta-induced errors in the cost of capital that could be as high as 6%.
The Debt-to-Equity Ratio
The next step is to estimate the relative proportions of debt and equity that are appropriate to finance a project. One would expect a consensus about how to measure the percentage of debt and equity a company should have in its capital structure; most textbooks recommend a weighting that reflects the overall market capitalization of the company. But the AFP survey showed that managers are pretty evenly divided among four different ratios: current book debt to equity (30% of respondents); targeted book debt to equity (28%); current market debt to equity (23%); and current book debt to current market equity (19%).
Because book values of equity are far removed from their market values, 10-fold differences between debt-to-equity ratios calculated from book and market values are actually typical. For example, in 2011 the ratio of book debt to book equity for Delta Airlines was 16.6, but its ratio of book debt to market equity was 1.86. Similarly, IBM’s ratio of book debt to book equity in 2011 stood at 0.94, compared with less than 0.1 for book debt to market equity. For those two companies, the use of book equity values would lead to underestimating the cost of capital by 2% to 3%.
Project Risk Adjustment
Finally, after determining the weighted-average cost of capital, which apparently no two companies do the same way, corporate executives need to adjust it to account for the specific risk profile of a given investment or acquisition opportunity. Nearly 70% do, and half of those correctly look at companies with a business risk that is comparable to the project or acquisition target. If Microsoft were contemplating investing in a semiconductor lab, for example, it should look at how much its cost of capital differs from that of a pure-play semiconductor company’s cost of capital.
But many companies don’t undertake any such analysis; instead they simply add a percentage point or more to the rate. An arbitrary adjustment of this kind leaves these companies open to the peril of overinvesting in risky projects (if the adjustment is not high enough) or of passing up good projects (if the adjustment is too high). Worse, 37% of companies surveyed by the AFP made no adjustment at all: They used their company’s own cost of capital to quantify the potential returns on an acquisition or a project with a risk profile different from that of their core business. These tremendous disparities in assumptions profoundly influence how efficiently capital is deployed in our economy. Despite record-low borrowing costs and record-high cash balances, capital expenditures by U.S. companies are projected to be flat or to decline slightly in 2012, indicating that most businesses are not adjusting their investment policies to reflect the decline in their cost of capital.
With $2 trillion at stake, the hour has come for an honest debate among business leaders and financial advisers about how best to determine investment time horizons, cost of capital, and project risk adjustment. And it is past time for nonfinancial corporate directors to get up to speed on how the companies they oversee evaluate investments.
Post a Comment